
The PGM Grade Trap: Why Grams per Tonne Only Tell Half the Story
Grade is usually the first number investors look at when a mining company reports a drill result, and PGM grade is no exception. It makes sense because it is simple. A hole running at 5 g/t looks better than one running at 1 g/t, and when two companies are exploring for roughly the same metals it is very easy to put the announcements beside each other and decide which one has the better project.
The problem is that mines are not built on grade alone. A tonne of mineralised material sitting 50 metres below surface in a broad, continuous body is a completely different proposition to the same tonne sitting a kilometre underground. The second deposit may carry several times the metal grade, but getting it to surface can require shafts, underground development, ventilation, cooling, ground support and a completely different mining fleet before you even think about processing it.
This distinction becomes particularly important in platinum group metals because the reference point most investors have is South Africa and Zimbabwe, where some of the world’s largest PGM operations are deep underground mines carrying grades well above what you would normally expect from a bulk open-pit deposit. Put those grades beside an emerging open-pit PGM-copper-nickel system and the lower-grade project can look ordinary very quickly, even though the comparison itself is not particularly useful.
I recently completed a global benchmarking exercise covering 18 operating and development-stage PGM-base metal assets where enough public information was available to make a meaningful comparison. Six are open-pit assets and 12 are underground, with 11 already operating and seven sitting somewhere between prefeasibility and construction. The work compared published Ore Reserve or equivalent grades for platinum, palladium and gold, referred to as 3E, alongside copper and nickel grades, scale, strip ratios and mining depth.
I went through the dataset because it answers a fairly simple question that comes up every time a broad PGM system is drilled: what actually constitutes a good grade if the deposit is not going to be mined like a South African underground reef?
Open-pit PGM grade looks very different
The six open-pit assets in the study are Boliden’s Kevitsa in Finland, Glencore and Teck’s NorthMet in the US, Nickel Creek Platinum’s Nickel Shäw in Canada, Chalice Mining’s Gonneville in Western Australia, Generation Mining’s Marathon project in Canada and Valterra Platinum’s Mogalakwena in South Africa.
Two are operating, Marathon has moved into construction following financing completed this year, while Gonneville and Nickel Shäw have completed prefeasibility work. NorthMet uses its historical 2022 feasibility-study Reserve because Glencore subsequently stopped declaring an Ore Reserve while permitting and project economics were being updated.
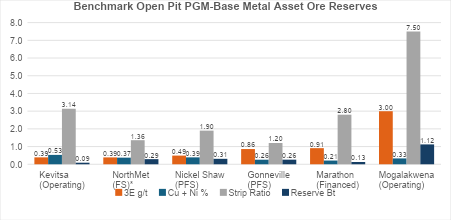
Across the entire open-pit group, the average Ore Reserve is 366 million tonnes grading 1.01 g/t 3E and 0.35% combined copper and nickel, with an average strip ratio of around 3:1. The number becomes much more interesting once Mogalakwena is separated out, because Mogalakwena is enormous and bears little resemblance to the rest of the peer group.
Mogalakwena alone carries more than 1.1 billion tonnes of Ore Reserves at around 3 g/t 3E. Excluding it, the other five open-pit projects average 215 million tonnes at just 0.61 g/t 3E and 0.35% copper plus nickel, with an average strip ratio of approximately 2.1:1.
That 0.61 g/t number is worth sitting with for a moment because these are not speculative exploration targets. The group includes an operating mine, advanced development projects and a project that has already been financed into construction.
Kevitsa’s Ore Reserve carries approximately 0.39 g/t 3E. NorthMet’s historical Reserve is also around 0.39 g/t. Nickel Shäw is approximately 0.49 g/t, Gonneville 0.86 g/t and Marathon 0.91 g/t. Mogalakwena sits well above all of them at 3.00 g/t.
If you judged those projects only on the PGM number, several would never make it past the first page of an investor presentation. Clearly something else is happening.
Underground has to carry more grade
The underground peer group is much closer to what most people associate with traditional PGM mining. It includes operating mines such as Impala Rustenburg, Impala Bafokeng, Marula, Two Rivers, Zimplats, Mimosa, Amandelbult and Unki, together with Nornickel’s Taimyr operations in Russia. Ivanhoe Mines’ Platreef, Platinum Group Metals’ Waterberg and Southern Palladium’s Bengwenyama make up the development end of the dataset.
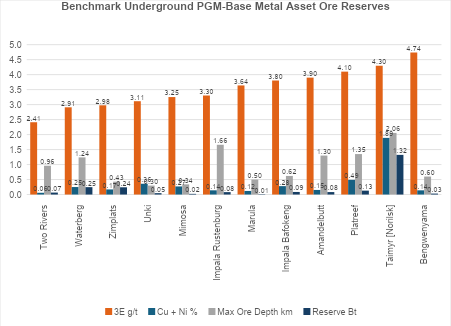
The average grade is much higher. Including Norilsk, the underground group averages 3.54 g/t 3E. Excluding it, the number is still 3.47 g/t, almost six times the open-pit average once Mogalakwena is removed.
At first glance that looks like an enormous advantage, until you put mining depth beside it. The average maximum depth to ore is around 950 metres including Norilsk and approximately 850 metres without it. Individual operations go considerably deeper, with the Taimyr system extending beyond two kilometres in places.
An open pit moves waste to expose ore. A deep underground mine has to build access to the ore and maintain that access for years. Shafts, declines, ventilation, refrigeration, ground support, underground workshops and development metres all become part of the cost base, while the amount of ore that can physically be mined from each working area is constrained by the geometry of the deposit.
The higher grades are not there by accident, they are what allow many of those deposits to support the additional complexity of being mined hundreds of metres, and in some cases kilometres, below surface.
Copper and nickel change the equation
There is another part of the comparison that tends to get lost when everyone focuses on the PGM number. These are not pure platinum and palladium deposits. They are polymetallic systems and the copper and nickel can make a meaningful contribution to the value of every tonne processed.
Excluding Norilsk, the underground peer group averages around 0.22% combined copper and nickel. The open-pit group excluding Mogalakwena averages approximately 0.35%. So the group carrying materially lower PGM grades actually has the higher average copper and nickel grade.
The same pressure sits on the copper side of these deposits, where the IEA has a 30% supply shortfall by 2035. Nickel demand has its own problem, with LFP taking battery share from 19% to 55%.
That does not mean an open-pit project is automatically better. Metallurgical recovery matters, concentrate quality matters, payability matters and the relative prices of platinum, palladium, copper and nickel will change over the life of a mine. The point is simply that a 3E number on its own does not tell you what the rock is worth.
The benchmarking also deliberately excludes a number of other potentially valuable elements from the headline comparison. Some projects report rhodium, ruthenium, iridium, osmium, cobalt and silver while others do not, so I left them out to keep the peer group as comparable as possible. Those metals can still contribute meaningful revenue at individual operations, but including them selectively would make the comparison less useful.
The mine gets paid for what it can recover and sell, not whichever metal happens to make the headline.
Mogalakwena shows another problem with headline numbers
Mogalakwena is useful for another reason because its published Ore Reserve grade and the actual grade going through the plant are not the same thing.
The Ore Reserve benchmark used in the study is approximately 3.00 g/t 3E. Actual operating data shows milled grade falling from around 3.1 g/t in 2021 to approximately 2.4 g/t in 2025, while throughput increased to 14.9 million tonnes. Over the same period, the strip ratio fell from around 6.3:1 to approximately 4.5:1.
There is nothing unusual about that. A Reserve grade represents the average of a much larger mineable inventory. What actually goes through the plant in a particular year depends on where the mine is operating, which benches are available, blending requirements and the sequencing of the mine plan. In Mogalakwena’s case, the lower strip ratio alongside the lower milled grade also illustrates the trade-off a mine can make between grade and mining cost, with lower-grade material potentially becoming attractive if substantially less waste needs to be moved to access it.
It does highlight a problem with the way exploration results are often compared in the market. A drill intersection, a Mineral Resource grade, an Ore Reserve grade and an annual plant head grade are four different things, yet they regularly end up on the same chart because they all happen to be expressed in grams per tonne.
That is where peer comparisons start getting dangerous. Putting one selected drill intercept beside the whole-of-Reserve grade of a producing mine can make a project look either far better or far worse than it really is.
The Resource is not the mine
The Resource-to-Reserve data in the study is probably the part I found most useful.
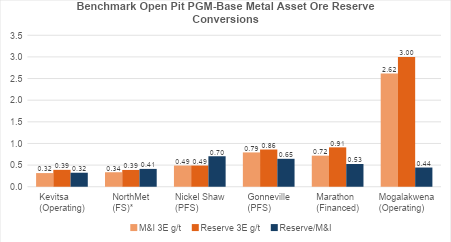
Across the open-pit peer group, only around 51% of Measured and Indicated Resources convert into Ore Reserves on average. With the exception of Nickel Shäw, the 3E grade actually increases during that conversion.
Marathon moves from roughly 0.72 g/t 3E in its M&I Resource to 0.91 g/t in the Reserve. Gonneville rises from approximately 0.79 g/t to 0.86 g/t and Mogalakwena from about 2.62 g/t to 3.00 g/t.
This is not particularly surprising once you think about what mine planning actually does. A Resource contains mineralised material considered to have reasonable prospects for eventual economic extraction. It does not mean all of those tonnes have to become part of the mine plan. When engineers design the pit, apply cut-offs and optimise the mining inventory, lower-value material can be excluded and the resulting Reserve grade can rise.
The underground dataset behaves differently. Average conversion from M&I Resources into Ore Reserves is only around 39%, and the Reserve 3E grade generally falls rather than rises. The study attributes this largely to underground mining dilution.
Again it comes back to geometry. You cannot mine a geological model with perfect precision. Underground stopes have minimum practical mining widths and development constraints, which means waste can end up being mined with the ore and the delivered grade falls.
Marathon is the example I keep coming back to
Generation Mining’s Marathon project in Ontario is probably the easiest example of why all this matters. Its Ore Reserve is around 128 million tonnes at 0.91 g/t 3E with approximately 0.21% copper, and the project carries a reported strip ratio of around 2.8:1.
Put 0.91 g/t beside a 3.5 or 4 g/t South African underground operation and it does not look particularly exciting. But Marathon is not being designed as an underground South African PGM mine. It is a bulk open-pit polymetallic operation with a completely different cost structure and mining method.
Generation Mining completed a financing package of nearly C$1 billion in 2026 and moved Marathon into construction. The scale of that funding is worth noting, with institutions including Société Générale, ING and Export Development Canada involved. While financing does not guarantee a project’s economics, lenders committing capital at that scale undertake substantial technical and financial due diligence. That gap between technical merit and financeability is the constraint across the sector.
That does not mean every 0.9 g/t PGM discovery will become a mine. Far from it. It shows that there is no universal grade threshold you can apply across every deposit and every mining method.
Mining companies do not generate returns based on who has the highest grams per tonne. They generate returns from the margin left after mining, processing, recoveries, payabilities, sustaining capital and every other cost required to turn rock into a saleable product.
Grade is part of that equation, but it is not the equation.
This is the kind of analysis we publish daily in The Drill Down. Subscribe HERE for free.
What I would look at before the grade
If there is no universal PGM grade that makes a deposit economic, the obvious next question is what should investors actually be looking at.
For me there are six things that need to be understood before a headline grams-per-tonne number becomes particularly useful.
1. Depth to ore.
This is probably the most obvious one. Material sitting close to surface can potentially be accessed with an open pit, while material hundreds of metres underground needs declines, shafts and underground development before it can be mined. The underground peer group in this study averages maximum depths of around 850 to 950 metres. That additional infrastructure and operating complexity is part of the reason those deposits need to carry materially higher grades.
2. Strip ratio.
For an open pit, the question is not just how much ore is there but how much waste has to be moved to get to it. Outside Mogalakwena, the open-pit group averages a strip ratio of approximately 2.1:1. A large, shallow deposit can still become difficult very quickly if too much waste has to be moved for every tonne of ore mined.
3. Thickness and geometry.
A narrow underground reef and a broad mineralised package are completely different mining propositions. Thickness, continuity and orientation influence what mining method can ultimately be used, how selectively the ore can be mined and how much dilution or waste movement comes with it. Geometry therefore has a direct impact on the cost structure the grade has to support.
4. Metal mix.
These are polymetallic deposits, so the PGM number is only part of the value. The open-pit peer group excluding Mogalakwena averages around 0.35% combined copper and nickel, compared with approximately 0.22% for the underground group excluding Norilsk. Two deposits with the same 3E grade can therefore have quite different values per tonne depending on how much copper, nickel and other payable metal sits alongside it.
5. The metal basket.
Even the 3E number itself can hide important differences. Platinum, palladium and gold do not contribute the same value per gram, and some deposits also carry rhodium and other metals that are not consistently reported across the peer group. A 1 g/t PGM number is therefore not necessarily worth the same amount from one deposit to another.
6. Metallurgy and route to market.
None of the metal matters if it cannot be recovered economically and sold on acceptable terms. Recoveries, concentrate grade, impurities, payabilities, transport and access to suitable downstream processing can all materially change what the mine ultimately receives for each tonne processed.
That is why I would be careful about reducing a PGM project to a single grade threshold. Grams per tonne matters, but only after you understand what has to be mined, how it will be mined and what can actually be recovered and sold.
Which brings me to Terra Metals’ Southwest Project
Terra Metals’ Southwest discovery at the Dante Project in Western Australia is what prompted the benchmarking work in the first place.
Southwest remains an exploration-stage discovery and does not yet have a MRE. Terra is currently drilling to define the scale, continuity, grade distribution and geometry of the system, with a maiden Southwest MRE the next major technical milestone.
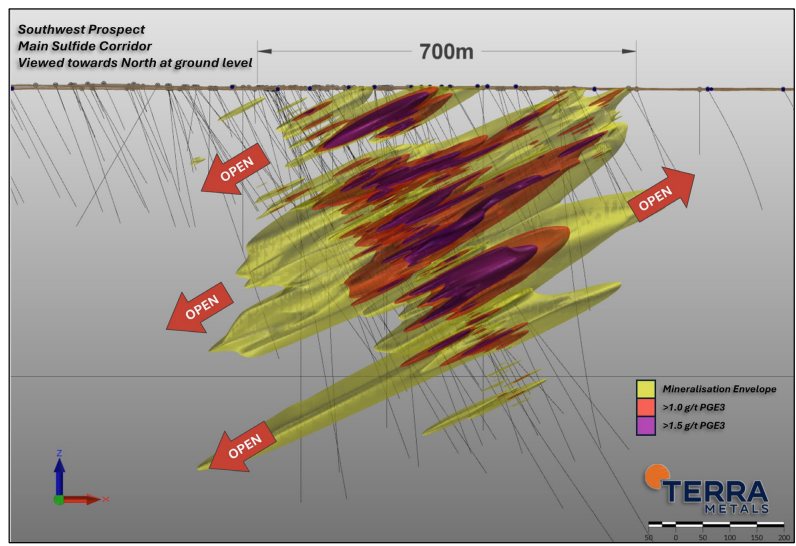
The company has continued to extend the mineralised footprint through 2026. Its 8 September announcement reported approximately 79.8 metres at 1.30 g/t 3E, as well as 14 metres at 3.13 g/t 3E, including 5 metres at 5.45 g/t 3E. The broader hole returned more than 200 metres of mineralisation. Importantly, the cross-section accompanying the September results also shows the interpreted mineralised system extending to surface, providing additional context around the potential geometry of the discovery despite the reported intersections being encountered at depth.
Earlier drilling had already demonstrated broad PGM-copper-nickel sulphide mineralisation across a growing footprint. By March the company was reporting continuity across hundreds of metres of width and strike, while subsequent drilling through June, July and August continued to extend the system.
The easy thing to do is take an intersection like 80 metres at 1.30 g/t and immediately ask whether 1.30 g/t is high enough. At this stage, though, I think the more important questions are what the final geometry looks like, how continuous the mineralised packages prove to be, how much tonnage can ultimately be defined, where the higher-grade zones sit within the broader system, how copper and nickel are distributed through it and what metallurgy eventually says about recoveries.
That is also where the current geological interpretation becomes useful. Terra’s 3D model shows multiple higher-grade PGM domains sitting within a much broader mineralised corridor, with the system remaining open in several directions. It is still an exploration model rather than a Mineral Resource or mine design, but it gives some context to why geometry has become such an important part of the Southwest story.
Until Southwest has a Mineral Resource and the technical work progresses further, nobody can responsibly say what the eventual mining method or economics will look like. What the benchmarking can do is provide context for the results being reported and show why grade should not be looked at in isolation.
An investor looking at a broad PGM-copper-nickel system should not automatically compare its headline grade with a deep underground mine and conclude that one is better than the other. The mining methods, scale, geometry, depth and metal mix are simply too different.
What people will overlook
The market likes grade because grade is easy. It fits neatly into a headline and it gives investors something they can compare within seconds.
Mining is not that simple and outside Mogalakwena, the open-pit assets in this dataset average only 0.61 g/t 3E, yet the group contains operating, financed and advanced development projects. The underground projects average closer to 3.5 g/t, but they are mining at average maximum depths approaching a kilometre and in many cases through complex shaft-based operations. The open-pit group also carries higher average copper and nickel grades once the obvious outliers are removed.
Then the numbers change again when a Resource becomes a Reserve. Open-pit mine design can increase the grade by selectively excluding lower-value material, while underground dilution can push grade in the opposite direction. Actual plant feed can then differ again depending on where the operation is mining in any particular year.
None of this proves that Southwest will become a mine, and that is not what the benchmarking is designed to do. Southwest still needs a maiden Resource, metallurgy, further drilling and ultimately the economic studies required to determine whether there is a development case.
What the work does show is that asking whether a PGM discovery is “high grade” without asking how it might eventually be mined is only half the question.
The first number everyone will keep looking at is grams per tonne.
The number that ultimately matters is what each tonne costs to turn into revenue.
PGM-Base Metal Asset Benchmark Ore Reserve Grades
| Company | Asset | Status | Mining Method | Mt | 3E g/t | Au g/t | Pt g/t | Pd g/t | Rh g/t | Cu % | Ni % |
|---|---|---|---|---|---|---|---|---|---|---|---|
| Valterra | Mogalakwena | Operating | Open-pit | 1,121.7 | 3.00 | 0.22 | 1.29 | 1.49 | 0.09 | 0.12 | 0.21 |
| Generation Mining | Marathon | Financed | Open-pit | 128.3 | 0.91 | 0.07 | 0.20 | 0.64 | NPR | 0.21 | NPR |
| Glencore/Teck | NorthMet | FS | Open-pit | 289.2 | 0.39 | 0.04 | 0.08 | 0.27 | NPR | 0.29 | 0.08 |
| Nickel Creek Platinum | Nickel Shäw | PFS | Open-pit | 307.7 | 0.49 | 0.04 | 0.22 | 0.23 | NPR | 0.13 | 0.26 |
| Boliden | Kevitsa | Operating | Open-pit | 88.4 | 0.39 | 0.09 | 0.18 | 0.12 | NPR | 0.31 | 0.22 |
| Chalice | Gonneville | PFS | Open-pit | 260.0 | 0.86 | 0.03 | 0.15 | 0.68 | NPR | 0.10 | 0.16 |
| Valterra | Amandelbult | Operating | Underground | 82.0 | 3.90 | 0.05 | 2.62 | 1.23 | 0.47 | 0.02 | 0.14 |
| Valterra | Unki | Operating | Underground | 45.7 | 3.11 | 0.25 | 1.59 | 1.28 | 0.14 | 0.14 | 0.22 |
| Ivanhoe | Platreef | Execution | Underground | 129.7 | 4.10 | 0.29 | 1.88 | 1.93 | 0.13 | 0.16 | 0.33 |
| Platinum Group Metals | Waterberg | FS | Underground | 246.2 | 2.91 | 0.18 | 0.85 | 1.88 | 0.04 | 0.08 | 0.17 |
| Southern Palladium | Bengwenyama | PFS | Underground | 31.7 | 4.74 | 0.07 | 2.34 | 2.33 | 0.48 | 0.02 | 0.12 |
| Nornickel | Taimyr Peninsula | Operating | Underground | 1,323.0 | 4.30 | 0.18 | 0.88 | 3.24 | NPR | 1.23 | 0.66 |
| Implats | Impala Rustenburg | Operating | Underground | 80.1 | 3.30 | 0.08 | 2.18 | 1.04 | 0.28 | 0.05 | 0.09 |
| Implats | Impala Bafokeng | Operating | Underground | 85.6 | 3.80 | 0.14 | 2.53 | 1.13 | 0.25 | 0.08 | 0.20 |
| Implats | Marula | Operating | Underground | 12.1 | 3.64 | 0.07 | 1.69 | 1.90 | 0.35 | 0.04 | 0.08 |
| Implats | Two Rivers | Operating | Underground | 65.2 | 2.41 | 0.03 | 1.47 | 0.91 | 0.27 | 0.01 | 0.05 |
| Implats | Zimplats | Operating | Underground | 241.5 | 2.98 | 0.22 | 1.53 | 1.23 | 0.13 | 0.07 | 0.10 |
| Implats | Mimosa | Operating | Underground | 22.6 | 3.25 | 0.28 | 1.65 | 1.32 | 0.14 | 0.12 | 0.15 |
NPR means not publicly reported. Scroll the table sideways to see all columns.
- Mogalakwena, Amandelbult and Unki: Valterra Platinum Ore Reserves and Mineral Resources Report 2025
- Marathon: Generation Mining technical report
- NorthMet: PolyMet Mining updated NI 43-101 technical report
- Nickel Shäw: Nickel Creek Platinum Prefeasibility Study
- Kevitsa: Boliden Mineral Resources and Mineral Reserves, Kevitsa, 31 December 2025
- Gonneville: Chalice Mining Prefeasibility Study
- Platreef: Ivanhoe Mines Platreef Integrated Development Plan 2025
- Waterberg: Platinum Group Metals NI 43-101 Waterberg Definitive Feasibility Study Update
- Bengwenyama: Southern Palladium Prefeasibility Study
- Taimyr Peninsula: Nornickel Annual Report 2025
- Impala Rustenburg, Impala Bafokeng, Marula, Two Rivers, Zimplats and Mimosa: Impala Platinum Mineral Resource and Mineral Reserve Report 2025
This analysis is from The Drill Down, a daily briefing on critical minerals, junior mining, and capital markets. Join 3,300+ investors and operators who read it before the market opens. Subscribe HERE.
Sources
Valterra Platinum 2025 Ore Reserves and Mineral Resources Report and 2025 operating statistics; Generation Mining Marathon technical reports and 2026 financing disclosures; Glencore Resources and Reserves Report 2023 and 2026 Half-Year Results; Boliden Kevitsa Mineral Resources and Mineral Reserves 2025; Nickel Creek Platinum Nickel Shäw Prefeasibility Study; Chalice Mining Gonneville Prefeasibility Study; Ivanhoe Mines Platreef Integrated Development Plan 2025; Platinum Group Metals Waterberg Definitive Feasibility Study; Southern Palladium Bengwenyama Prefeasibility Study; Nornickel 2025 Annual Report; Impala Platinum 2025 Mineral Resource and Mineral Reserve Report.
Terra Metals ASX announcements through 8 September 2026, including Sulfide System Expanded at Southwest, 5 March 2026; Drill Results Confirm Extension of PGM-Cu-Ni Mineralisation, 26 August 2026; and Southwest Returns 14m @ 3.13g/t and ~80m @ 1.30g/t 3E, 8 September 2026.
Disclosure
This article is general in nature and does not constitute personal financial advice. Readers should conduct their own due diligence and consult a licensed financial adviser before making any investment decisions. Southwest is currently an exploration-stage project and does not have a Mineral Resource Estimate or Ore Reserve. The peer benchmarking discussed in this article does not constitute an economic assessment of Southwest or establish that an economically viable mining operation will be developed. Terra Metals is a client of Kamoa Capital. Kamoa Capital has not received any additional payment specifically for the preparation or publication of this research.